Algorithms and Antipasti: Interpreting the Sales Data From Your Menu
Let’s start with a short refresher on menu engineering.
Menu engineering is data-driven menu design that analyzes the popularity and profitability of menu items. It couples this analysis with human behavior patterns to determine the best menu structure and organization for your restaurant’s menu.
Table Needs is a strong proponent of menu engineering for digital menus. That’s because it’s essential to know valuable restaurant menu data, including how menu changes increase profitability and how we can help users interpret sales reporting data.
After you finish A/B testing an item (or a few), sales data provides a more in-depth look at what the numbers say about item and menu performance. You can check out our A/B testing blog post to see the steps involved in gathering data to interpret.
4 Steps to Interpret the Numbers
Now, we’ll cover four ways you can slice that data to gain useful insights.
1. Look at your top sales by item.
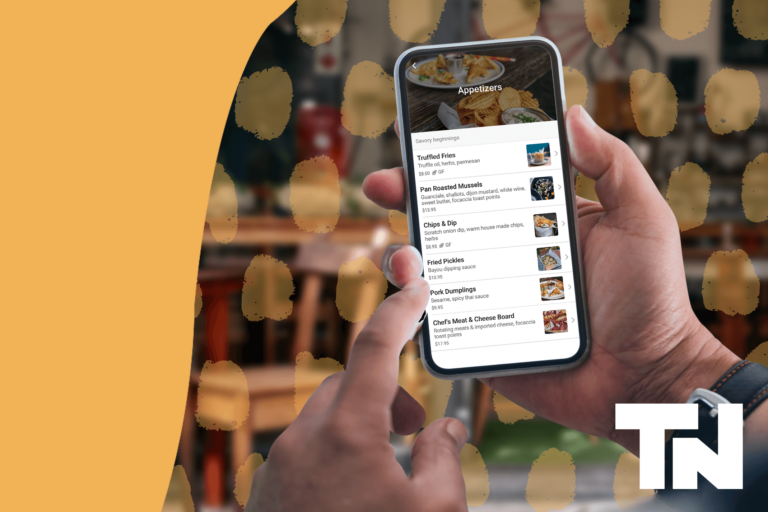
When you open the Table Needs menu manager, you can view your best-selling item by time frame. Is it Grandma’s famous baked potato? The hickory-smoked mac and cheese? The prime rib? The clam chowder?
When you find your best-selling item, it’s time to find ways to continue selling this item successfully. An example for full service is to ask servers at the beginning of the shift to greet tables and let them know that the prime rib is the best seller of the month. For quick service, create a flyer or have a chalkboard for the best-selling item of the month. Letting your customers know what sells best will intrigue them to want to try it too.
It’s also common for those visiting a restaurant online to look at reviews of the most-raved-about item. If this is also best-selling, has it quickly been 86’d? Maybe the ingredients can be used in other ways for new items to justify buying a higher quantity.
2. Look at your lowest sales by item.
When looking at your lowest-selling item, ask yourself these questions:
• How important to my menu is this item?
• What is the feedback from people who have tried this item?
• How much does it cost to make this item each time?
• How many of the ingredients are not repurposed?
• What effort have I put into promoting this item?
Now, let’s break down each step. It’ll guide you to a plan of action.
If your menu item is important, you’ll want to find a way to keep it on the menu. For example, if you started the restaurant to make your mom’s homemade chili, don’t give up on your dream just yet. Make sure your servers, your employees, or you are getting feedback when the item is sold. Is it too spicy? Is there too much corn? Do people just get thrown off that you mention it’s made with dark chocolate (the best way to make chili, we may add)? It might be that the recipe or menu description just needs a bit of tweaking.
Cost analysis should be done on all your menu items. Even if you don’t remove the menu item, how can you simplify it to save money? This also relates to ingredients. If you have a low-selling item that utilizes special ingredients, try to swap out one — or several. Work with your chef, and make it fun! Have them swap the ingredients in different ways as a test.
Last is our favorite option: Try to resell it! Maybe it’s not talked about enough. Maybe people don’t even get to that part of the menu before they see the prime rib. Make sure that before you assume people don’t want it, you’ve made an effort to promote it. Make it a game. Have your employees all on board to sell and promote the item as much as possible for the day and collect as much feedback as possible. Keep a tally of how many people turn down the offer and how much positive vs. negative feedback you get from guests.
3. Compare week-over-week sales by item.
After A/B testing, it’s important to see whether the changes you’ve made increased sales as expected. You can easily see items’ week-by-week sales numbers to know what works over a longer period of time.
Let’s say, for example, you’re testing two entrees: chicken and buttermilk waffles and chicken parmesan. Both are priced at $12 and cost $8 to make. Your testing time frame is a seven-day week that repeats for one month.
| Week 1 Profit | Week 2 Profit | Week 3 Profit | Week 4 Profit | |
| Chicken ‘n’ Waffles | $168 | $168 | $84 | $48 |
| Chicken Parmesan | $168 | $176 | $168 | $168 |
For the first week, the dishes’ profits balanced with the cost to make them, while customer demand was above expectations. But by week three, demand for chicken and waffles began to fall. After checking the week-by-week numbers, you see that keeping it on your menu is starting to cost more than it profits — compared to the chicken parmesan, it’s underperforming. You know that over a longer period of time, the chicken parmesan has a better chance to match demand on a more consistent basis.
Table Needs menu manager calculates this math to help you better understand how menu items are performing overall. It also highlights the trends over broader time frames, which can better inform your decisions about keeping, changing, or removing items from your menu.
4. Review your voids and comps.
Part of data interpretation is paying attention to details that help you see the bigger picture. Voids and comps are two details that cannot be overlooked.
Analyze all your voids and comps, taking note of which dishes they were. Pinpoint which ones were due to oversights or mistakes in the kitchen, accidents by kitchen or waitstaff, wrong orders, wrong ingredients, or dissatisfied customers. If someone sent the chicken and waffles back because it wasn’t what they expected, take that as a sign that you might need to add more detail to your menu item description or even reimagine how the dish is made.
Sometimes it comes down to misinterpreting a menu description. Need an example? Spice-sensitive guests might find your house tomato salsa spicier than they anticipated. Consider designating it as “spicy” with an icon, such as a flame or red chili pepper, next to it (and other spicy menu items) to avoid unwelcome surprises. Want to cast a wider net? Offer the option of a mild salsa.
Ah, the Joy of Food and Formulas
We totally get it. Interpreting sales reporting data is work. But the process doesn’t have to be draining, and menu optimization doesn’t have to take away from quality time spent building customer relationships — or fostering a bond among your team. You can transform that monochrome book of item lists into an appetizing menu and marketing tool that works with your business model, from the appearance to the hard data. Let menu manager be the one-stop-shop for everything your restaurant needs to grow.
Follow us for tips, news, and tutorials to run a successful small restaurant.